The return of GLP comes from three places: protocol fees, trader PnL, and the price movement of the underlying assets. If the last sentence reads like Sanskrit to you, you’d want to start here and here first. In this article, I will analyze how much return trader PnL alone contributes to GLP holders, and compare it with GLP’s yield, while ignoring the return from the price movement of GLP’s underlying assets. Let’s jump right into it.
Arbitrum
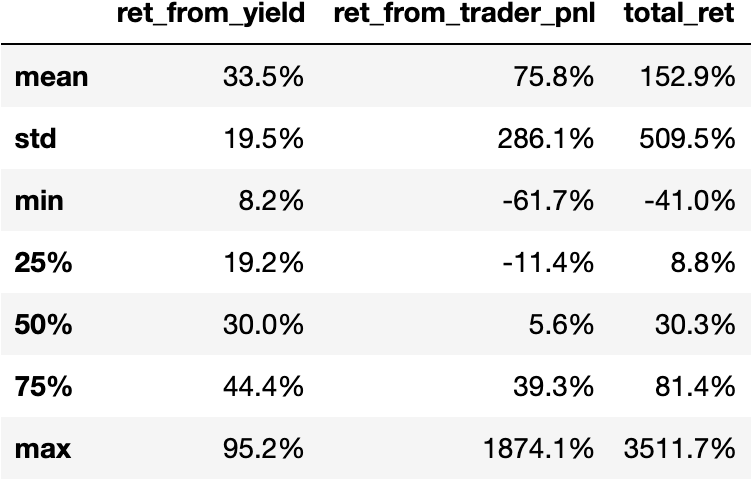
The following table presents summary statistics of the annualized weekly returns1 for GLP holders on Arbitrum. The average return contributed by trader PnL alone is 75.8%, more than 2X of the average yield, which is 33.5%, and together they give GLP holders an average return of 152.9%. The median return contributed by trader PnL alone is 5.6%, much lower than the mean (75.8%). So there is a small number of weeks where traders had big losses, which translated to huge positive returns to GLP holders2. Indeed, there are 8 such great weeks for GLP holders so far, and in the best case, GLP holders enjoyed a 1874% return solely from traders’ loss and a 3512% return after including the yield. On the other hand, in the worst case, GLP holders suffered a -61.7% return solely from traders’ gains and a -41% return after including the yield.

Let’s plot the weekly returns without the 8 spectacular weeks to see how things look for “regular” weeks. In the chart below, the blue curve dips below zero between October and mid November 2021, but stays mostly above zero in 2022 except in April. So GLP holders have been making positive returns (from yield and trader PnL) for most of the “regular” weeks as well.
The next two graphs plot trader-PnL-alone generated return and GLP yield respectively. When trader-PnL-alone generated return is high, does the yield tend to be high or low? To find out, I calculated their correlation and got a value of 0.34 when including the 8 spectacular weeks and a value of -0.48 when excluding them. So they are negatively correlated during “regular” times and strongly positively correlated during times when traders get rekt, so much so that including those times reverse the medium negative (-0.48) correlation to medium positive (0.34). In other words, during “regular” times, higher trader-PnL-alone generated return tends to correspond with lower yield, whereas during times when traders get rekt, higher trader-PnL-alone generated return tends to go hand in hand with higher yield.
Avalanche
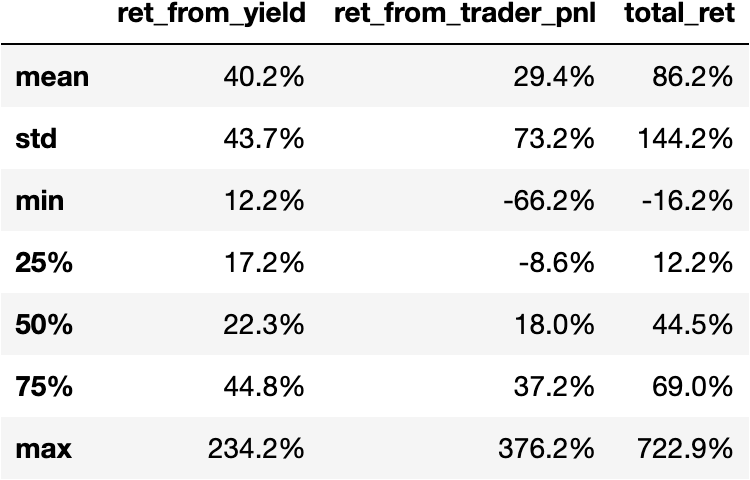
The following table presents summary statistics of the annualized weekly returns for GLP holders on Avalanche. The average return contributed by trader PnL alone is 29.4%, lower than the average yield, which is 40.2%, and together they give GLP holders an average return of 86.2%. The median return contributed by trader PnL alone is 18%, lower than the mean (29.4%). There are 3 weeks when traders lost big to GLP holders, and in the best case, GLP holders enjoyed a 376% return solely from traders’ loss and a 723% return after including the yield. On the other hand, in the worst case, GLP holders suffered a -66% return solely from traders’ gains and a -16% return after including the yield; the yield greatly offset GLP holders’ losses to traders.

Let’s plot the weekly returns without the 3 spectacular weeks to see how things look for “regular” weeks. In the chart below, the blue curve almost never dips below zero. So GLP holders have been making positive returns (from yield and trader PnL) for the “regular” weeks as well.
The next two graphs plot trader-PnL-alone generated return and GLP yield respectively. When trader-PnL-alone generated return is high, does the yield tend to be high or low? To find out, I calculated their correlation and got a value of 0.16 when including the 3 spectacular weeks and a value of -0.1 when excluding them. So they are mildly negatively correlated during “regular” times and strongly positively correlated during times when traders get rekt, so much so that including those times reverse the mildly negative (-0.1) correlation to mildly positive (0.16). In other words, during “regular” times, higher trader-PnL-alone generated return tends to correspond with lower yield, whereas during times when traders get rekt, higher trader-PnL-alone generated return tends to go hand in hand with higher yield. The correlation strength is much weaker than on Arbitrum though.
Data & Code
Arbitrum Data (2021-09-01 ~ 2022-09-10) and Python Notebook
Avalanche Data (2022-01-07 ~ 2022-09-10) and Python Notebook
Referrals
This section contains affiliate links to crypto products. If you click on the link and use the product, I may receive a small commission at no cost to you. I only link to products I use myself.
Get 5% discount when trading on GMX.
Juno Finance offers free onramp to Arbitrum, Optimism and Solana, a high interest bearing checking account (currently at 5%), and a great loyalty program that gives ledger, gift cards, and 5% cash back for spending. You will get $10 and 500 JCOIN if you use my referral link to open an account and fund it with $50 worth crypto or more. Available to US persons and requires KYC.
If you enjoyed this article and would like to buy me a coffee, you can send ETH, WBTC, AVAX, BNB, USDC, USDT to 0x783c5546C863f65481BD05Fd0e3FD5f26724604E, or you can tip me sat. Thank you and have a great day!
The tot_ret column does not factor in price movement of GLP’s underlying assets. It only includes GLP yield and trader PnL.
This is because the mean is heavily influenced by extreme values while the median is not.


