
A trading Strategy with Bollinger Bands (BB) and Relative Strength Index (RSI)
A trading Strategy with Bollinger Bands (BB) and Relative Strength Index (RSI)
Backtest and Compare with BuyHold

I haven’t coded in python for more than a week and I miss it. So I backtested a simple strategy that exploits the mean-reversion nature of price action and compared with buy-n-hold. The results indicate my strategy outperformed buy-n-hold during bear market and underperformed it during bull market. In this article, I will first describe my strategy and then show you the backtest results. I will also give you suggestions on how to improve the strategy. Finally, I will provide links to my notebook at the end. Let’s get started.
Strategy Description
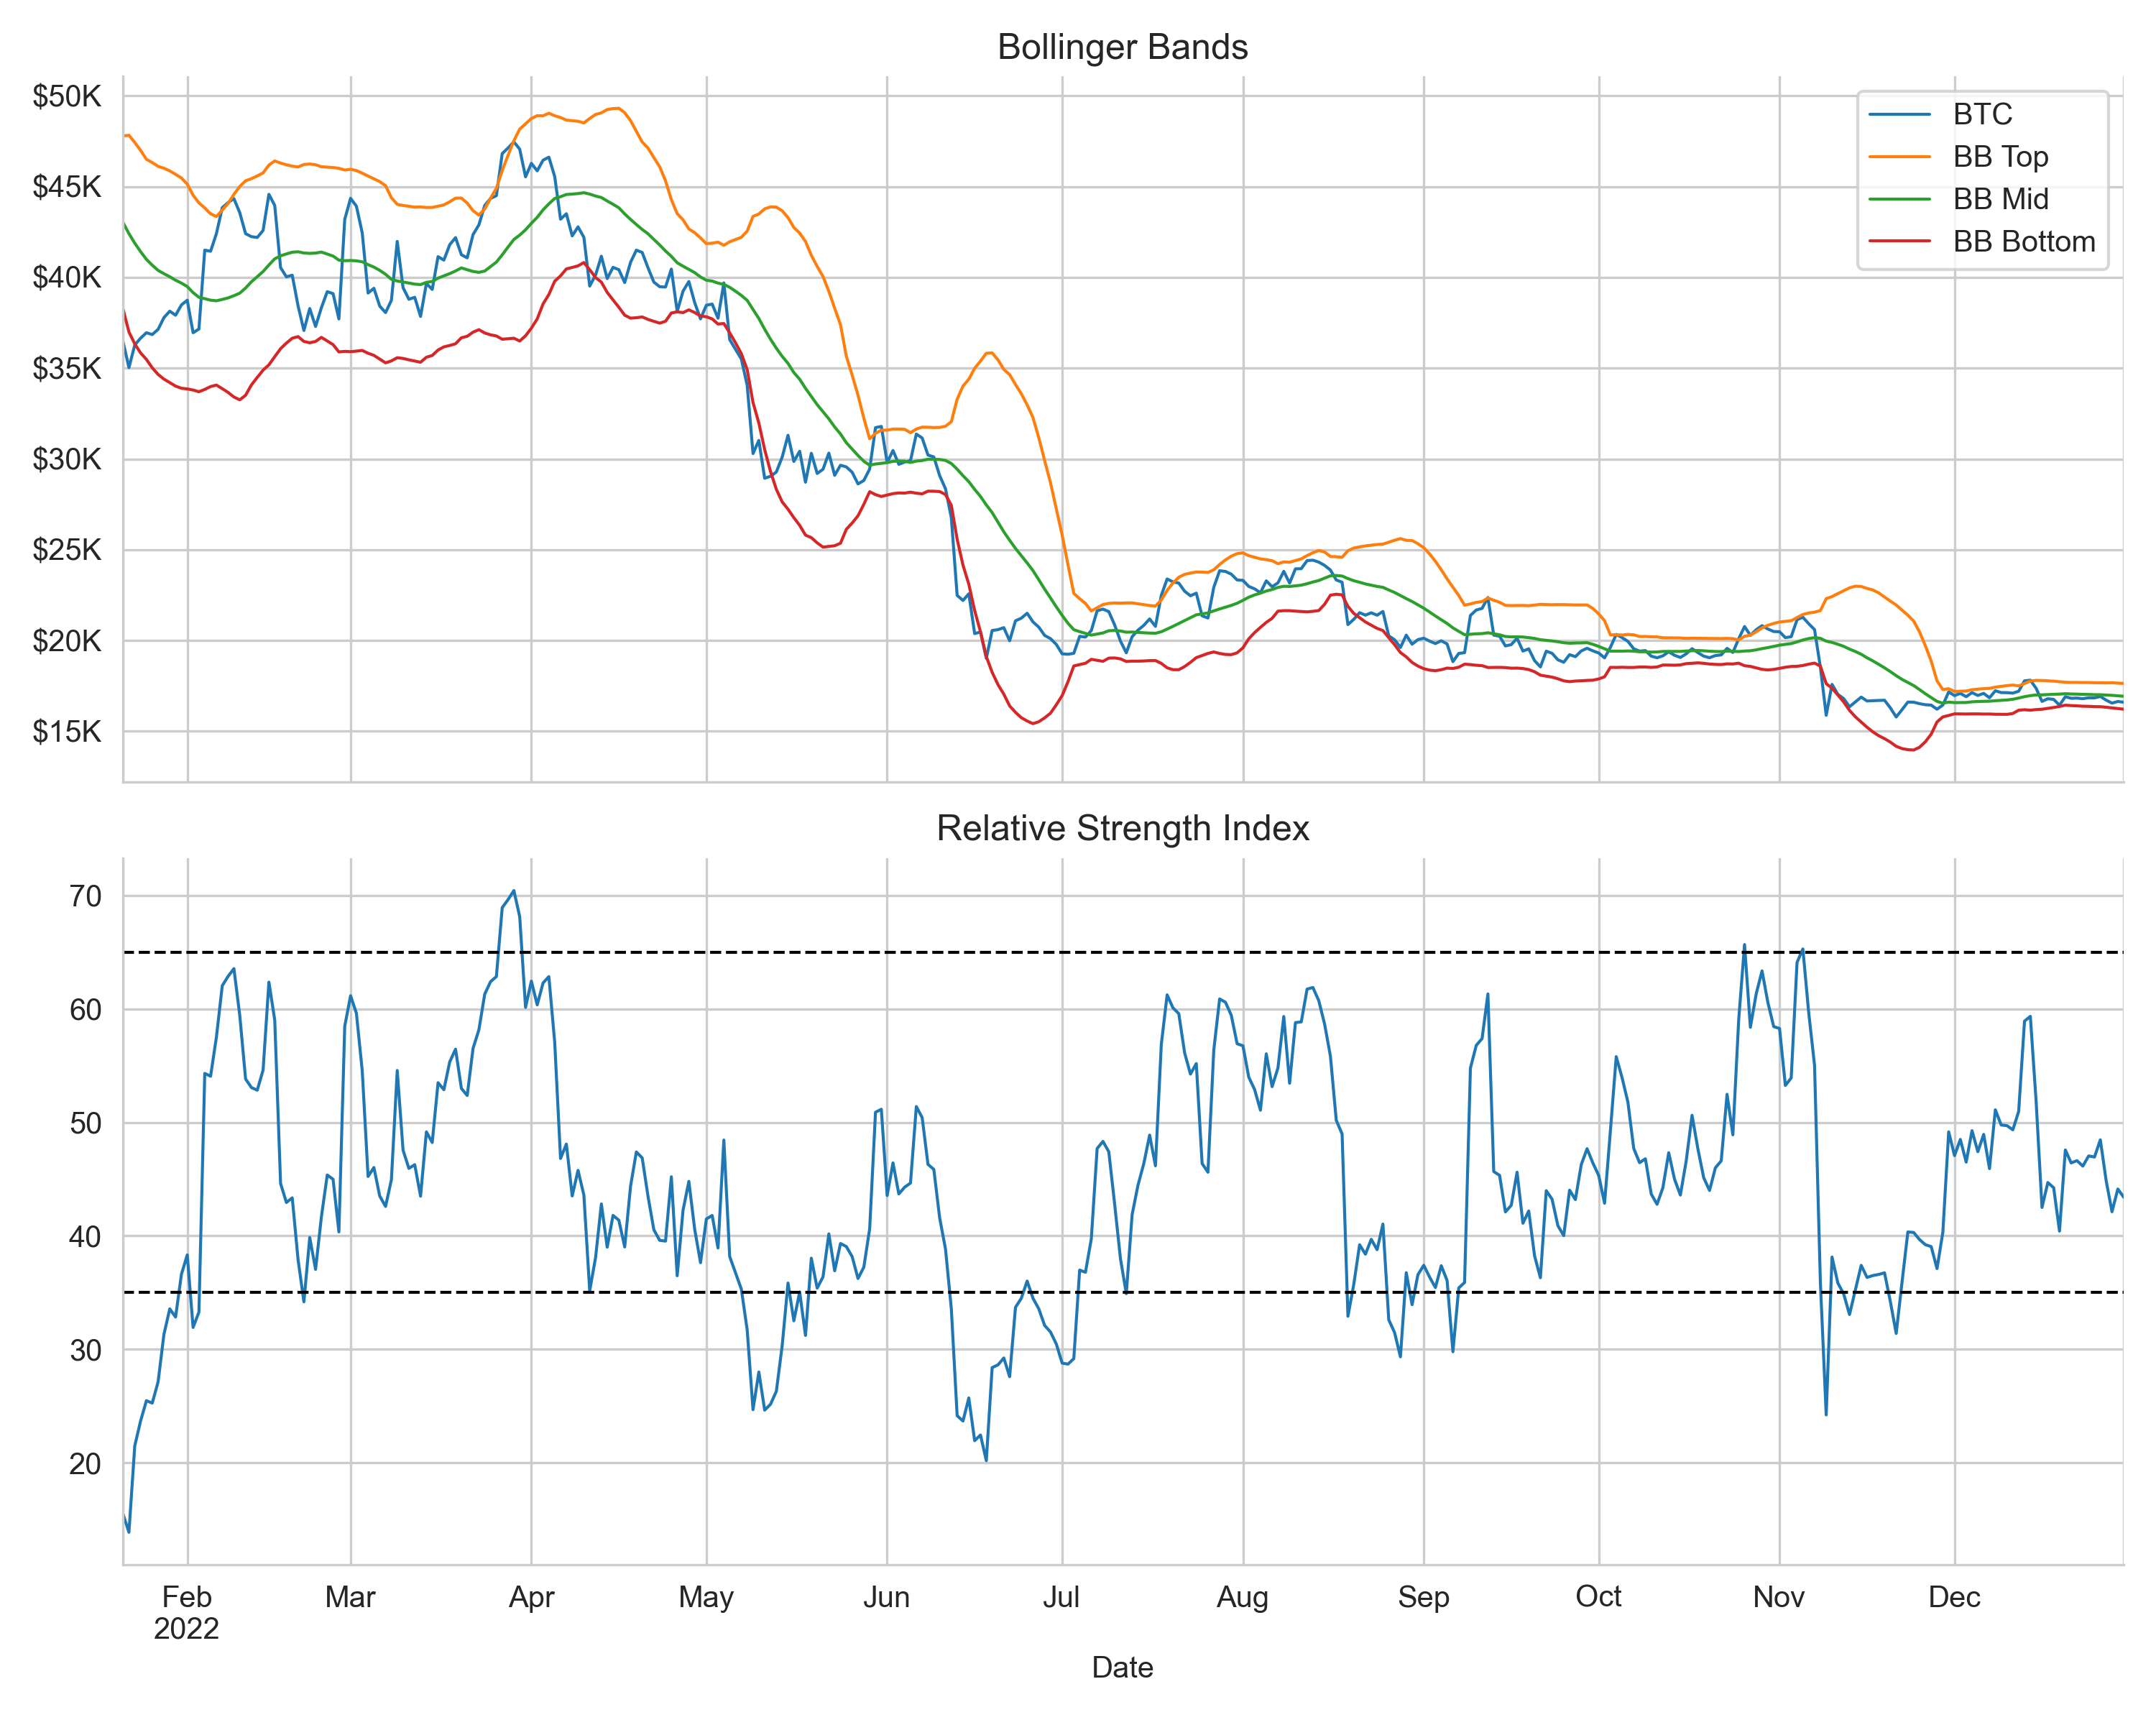
The strategy uses the confluence of two signals: Bollinger Bands (BB) and Relative Strength Index (RSI). Bollinger Bands are two rolling standard deviations bands below and above the simple moving average of price. When price rises above the upper band, the token may be overbought, presenting an exit opportunity. On the other hand, when price dips below the lower band, the token may be oversold, presenting a potential entry point. RSI computes the average price change for a given number of prior trading days with rising and falling prices, with RSI > 70 indicating a potentially overbought token and RSI < 30 potentially oversold. For example, the following chart plots the Bollinger Bands and RSI for BTC between 01 Jan 2022 and 31 Dec 2022.
Here’s a general description of my strategy:
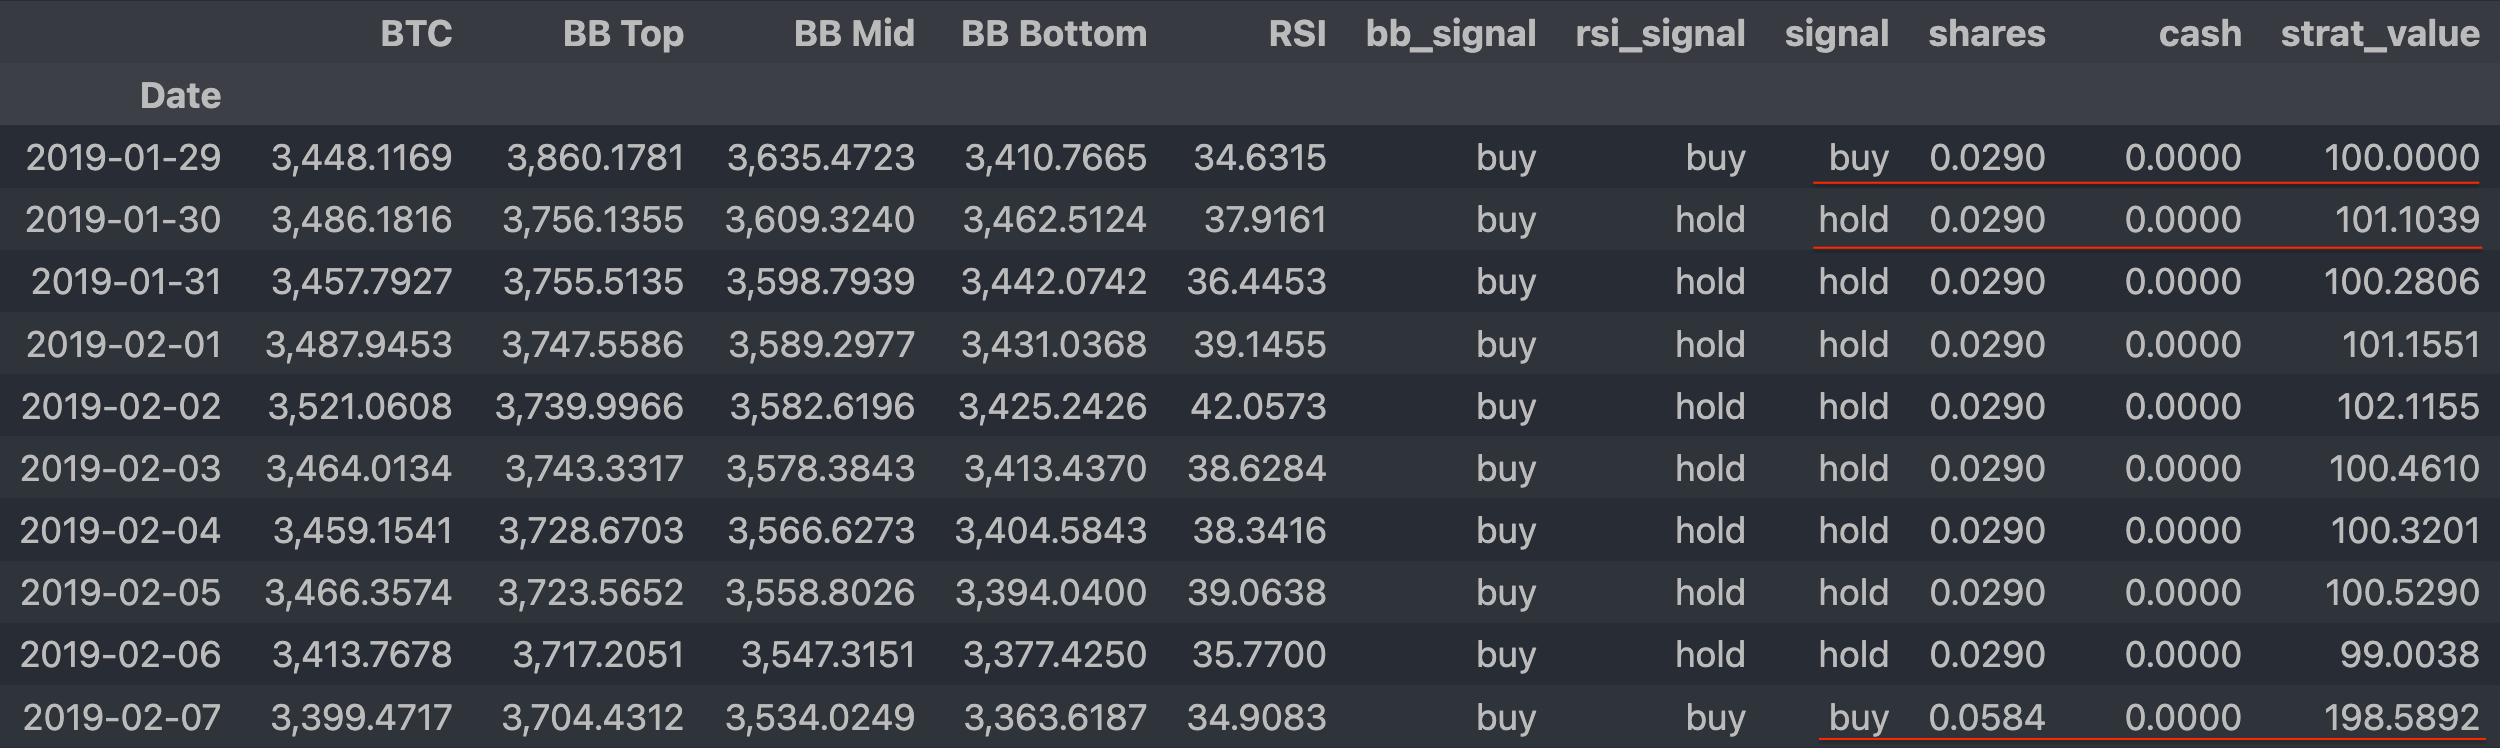
Calculate BBs and RSI with 21-day and 14-day rolling periods respectively.
Buy when price falls below 110% of BB bottom band and RSI falls below 35.
Sell when price rises above 90% of BB top band and RSI rises above 65.
No shorting, no leverage.
Specifically for this backtest exercise, I applied the strategy to BTC and ETH. I sell 100% whenever a sell signal flashes, in other words, I’m 100% in cash after a sell. And whenever a buy signal flashes, I buy with all cash in hand plus $100. Let me illustrate the strategy with the screenshot below. In this example, the first buy signal occurred on 29 Jan 2019 and the strategy spent $100 to buy 0.029 BTC at a price of $3448.1169. The next day there was no trade because the strategy signaled hold. But because the price went up, the value of our holdings (token + cash) increased to $101.1039. Now look at the last row, we have another ‘buy’ signal so the strategy bought another $100 and resulted a total share of 0.0584 BTC and value of $198.5892.
Let’s look at how the strategy sells. In the screen below, the first row, 17 Feb 2019, has a hold signal, with 0.0584 BTC valued at $214.617. The next day the strategy gave a sell signal and sold 100% of the 0.0584 BTC and resulted a $228.7469 cash position. On the following day, the strategy signaled another sell, but because it already sold all of the BTC holdings, it simply carried forward the cash position. Now at the next buy signal, the strategy would buy BTC with $328.7469 ($228.7469 + $100).

Backtest Results
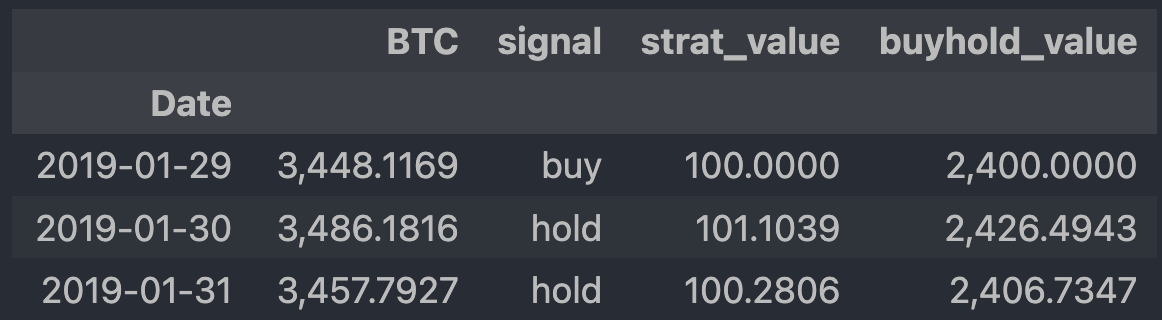
Continuing with the above example, between 01 Jan 2019 and 31 Dec 2019, there was 24 ‘buy’ signals, which translated to a total capital injection of $2400. We can compare the strategy performance with buy-n-hold, i.e., buy BTC with $2400 on 29 Jan 2019, the day when the first ‘buy’ signal occurred, and hold it until the last day of 2019. The following screen shows the first three rows in the performance table.
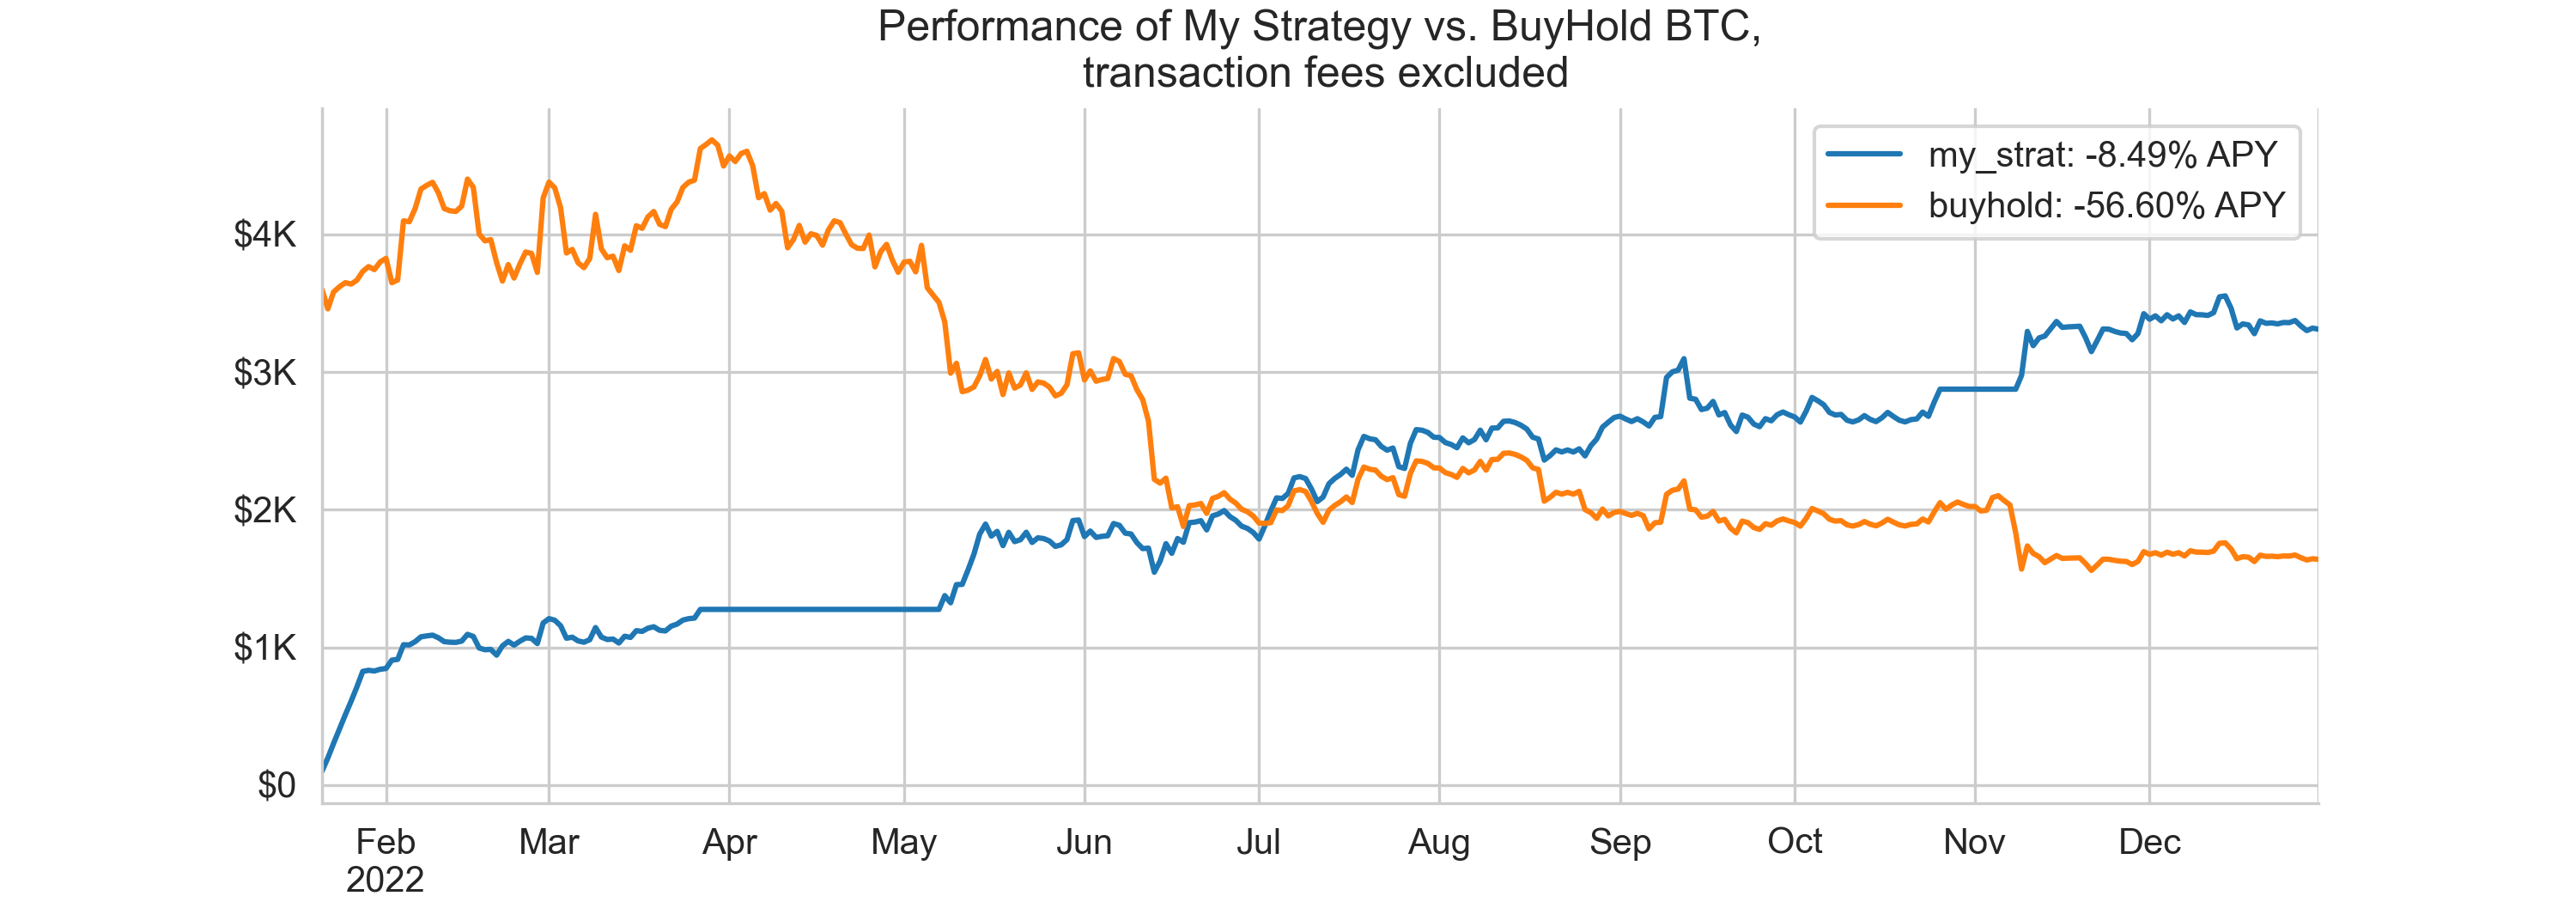
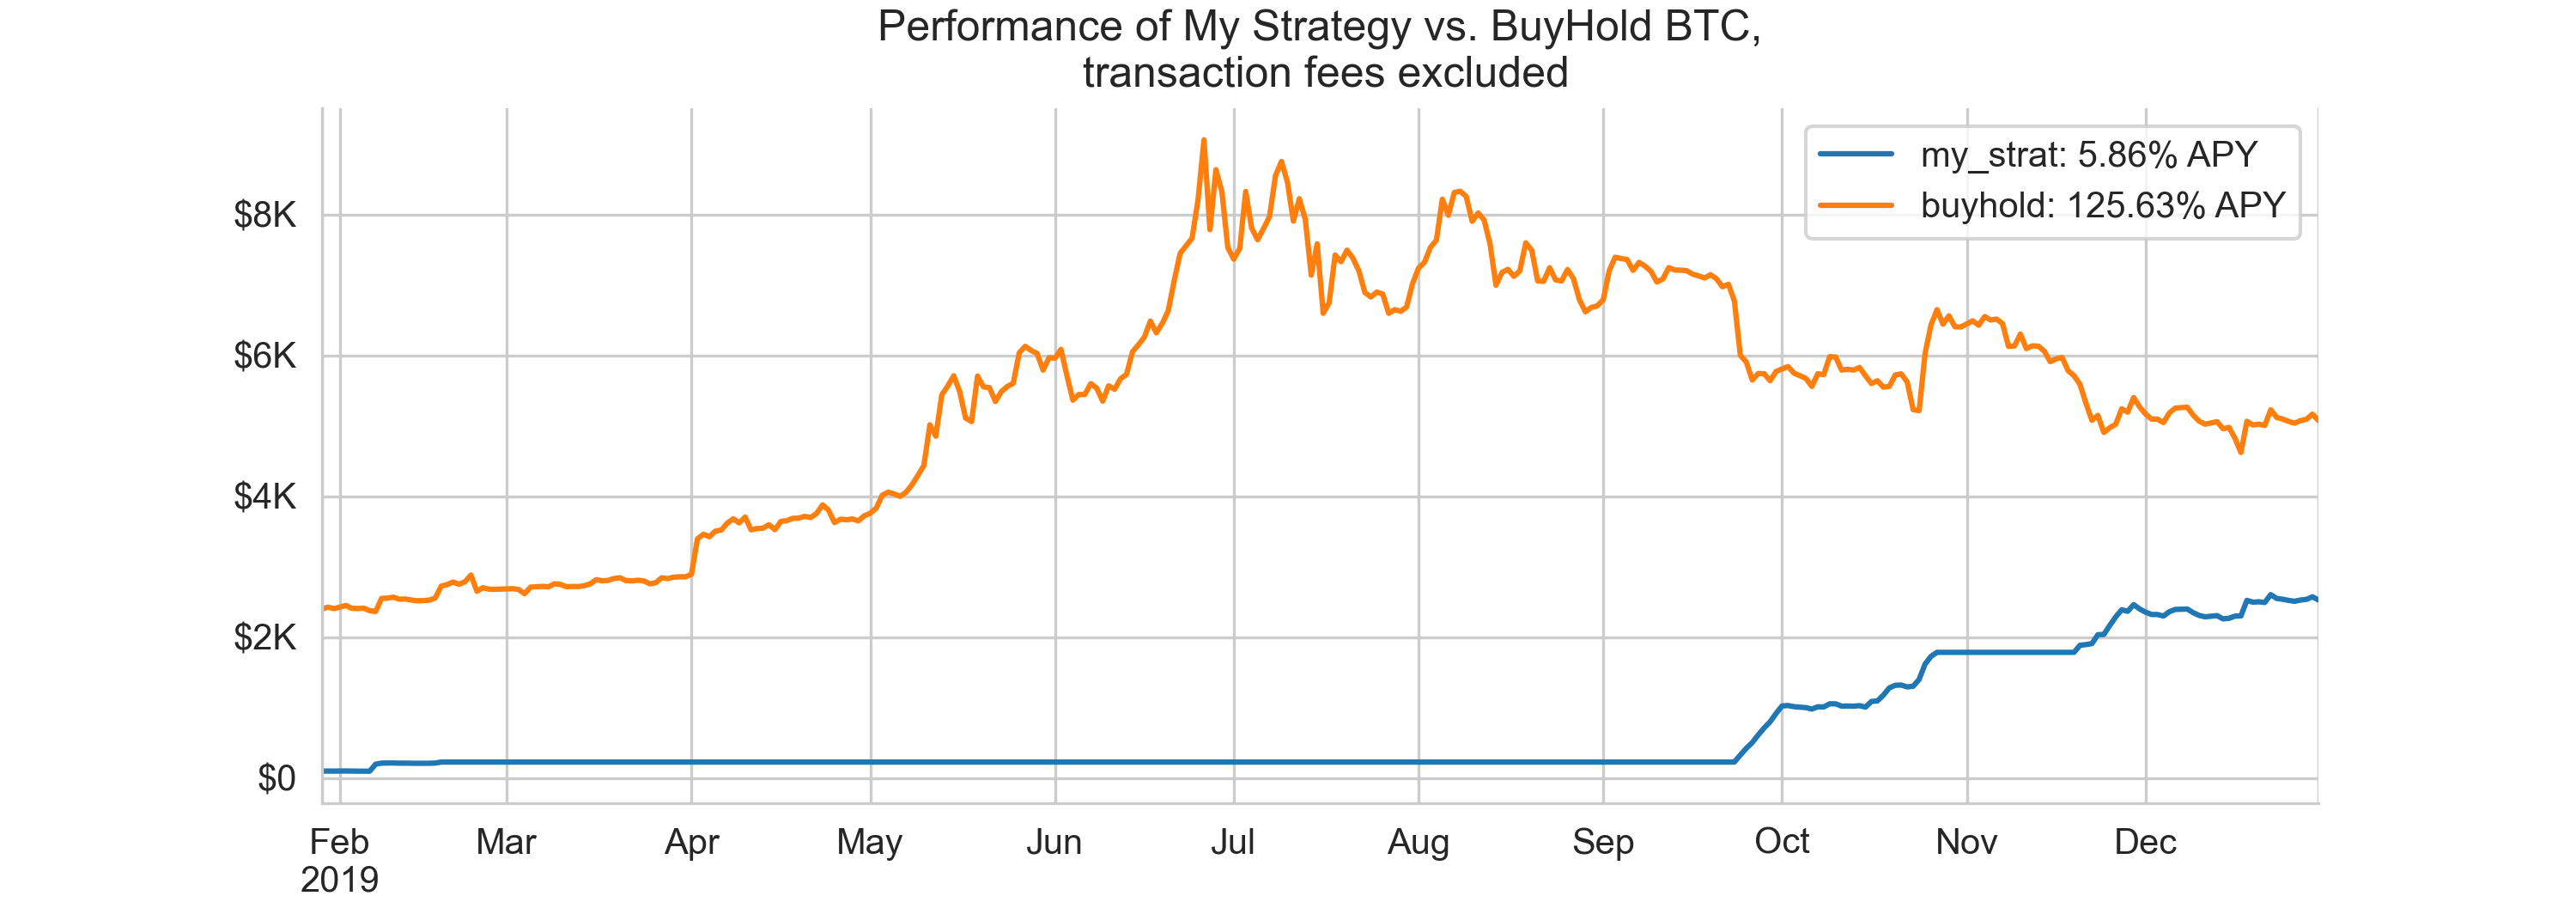
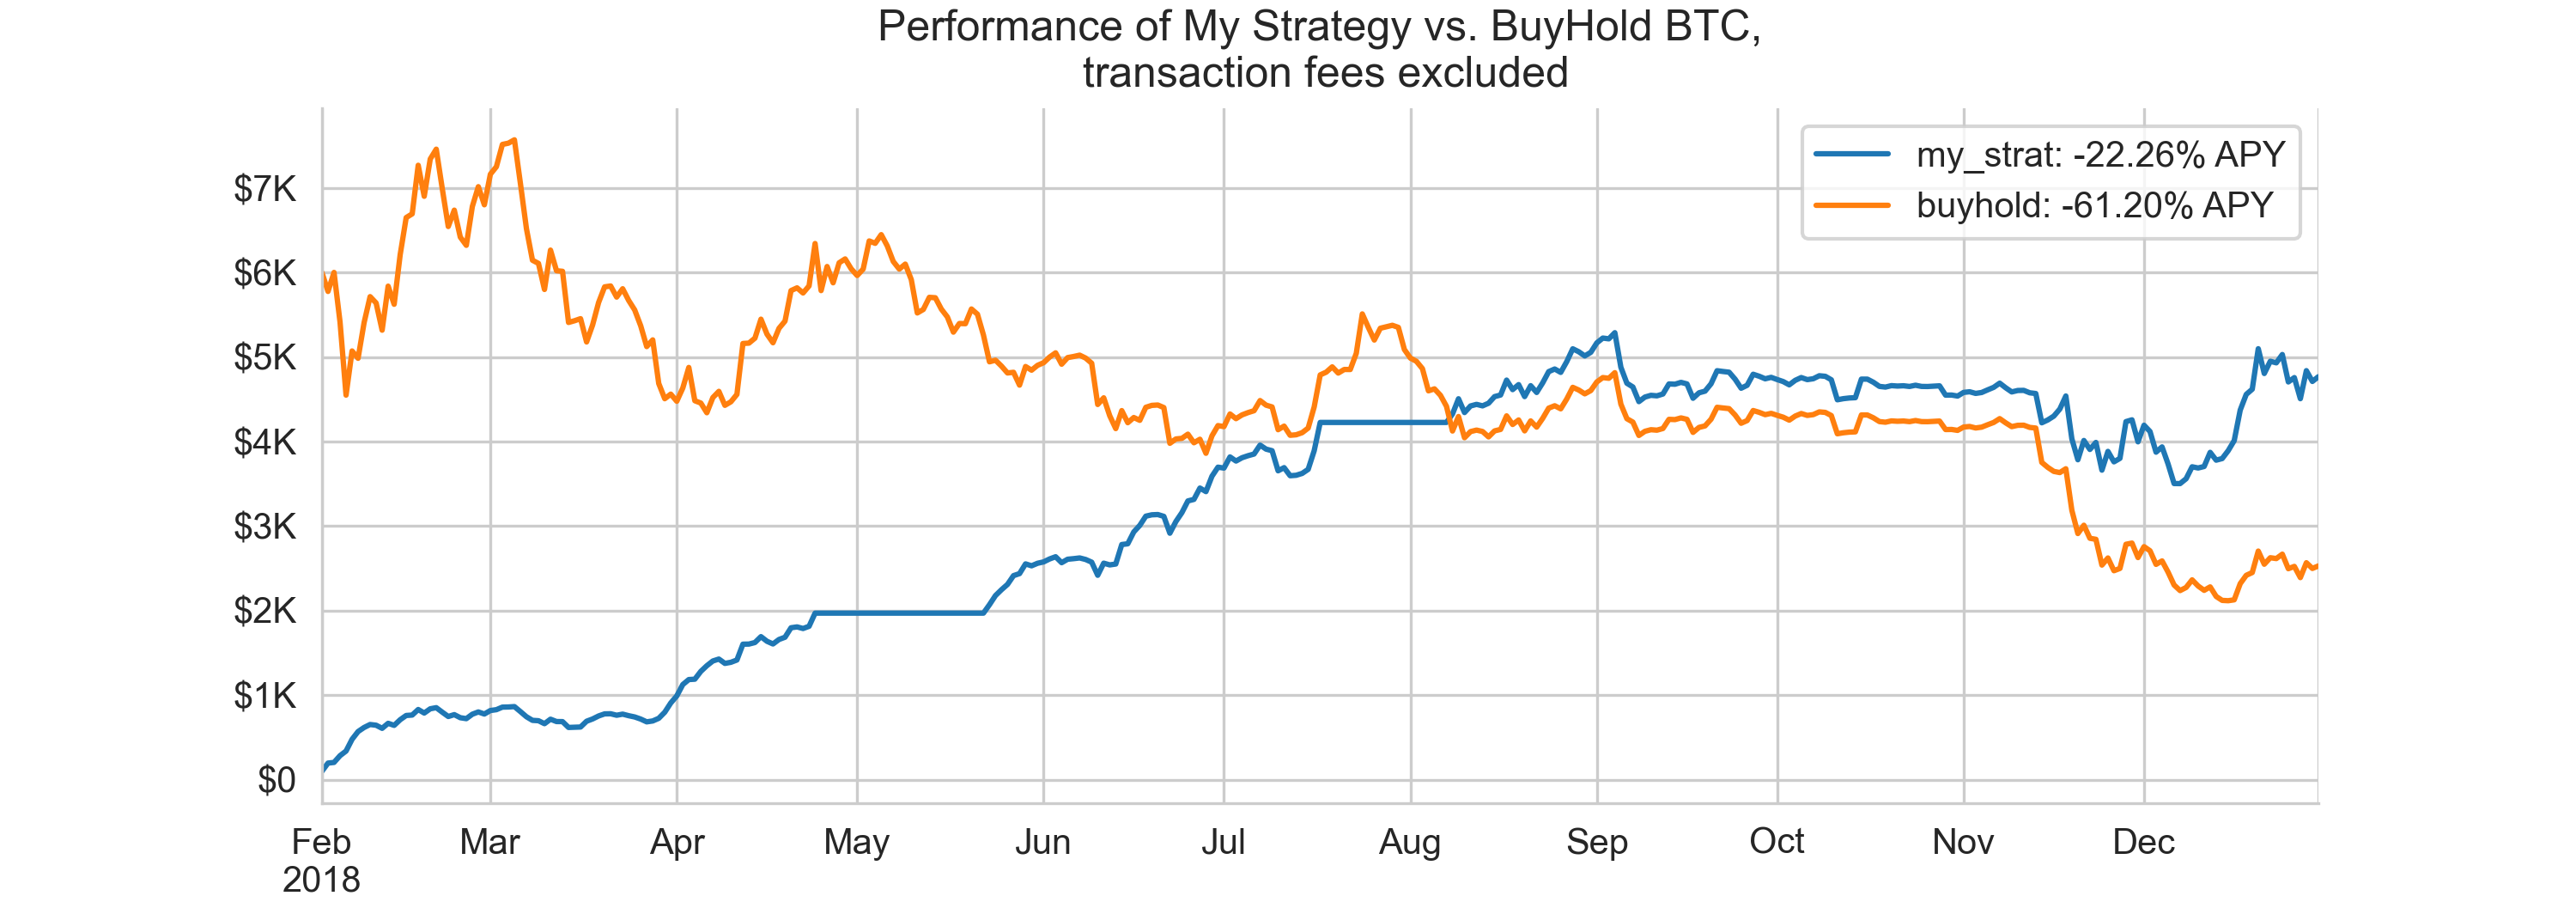
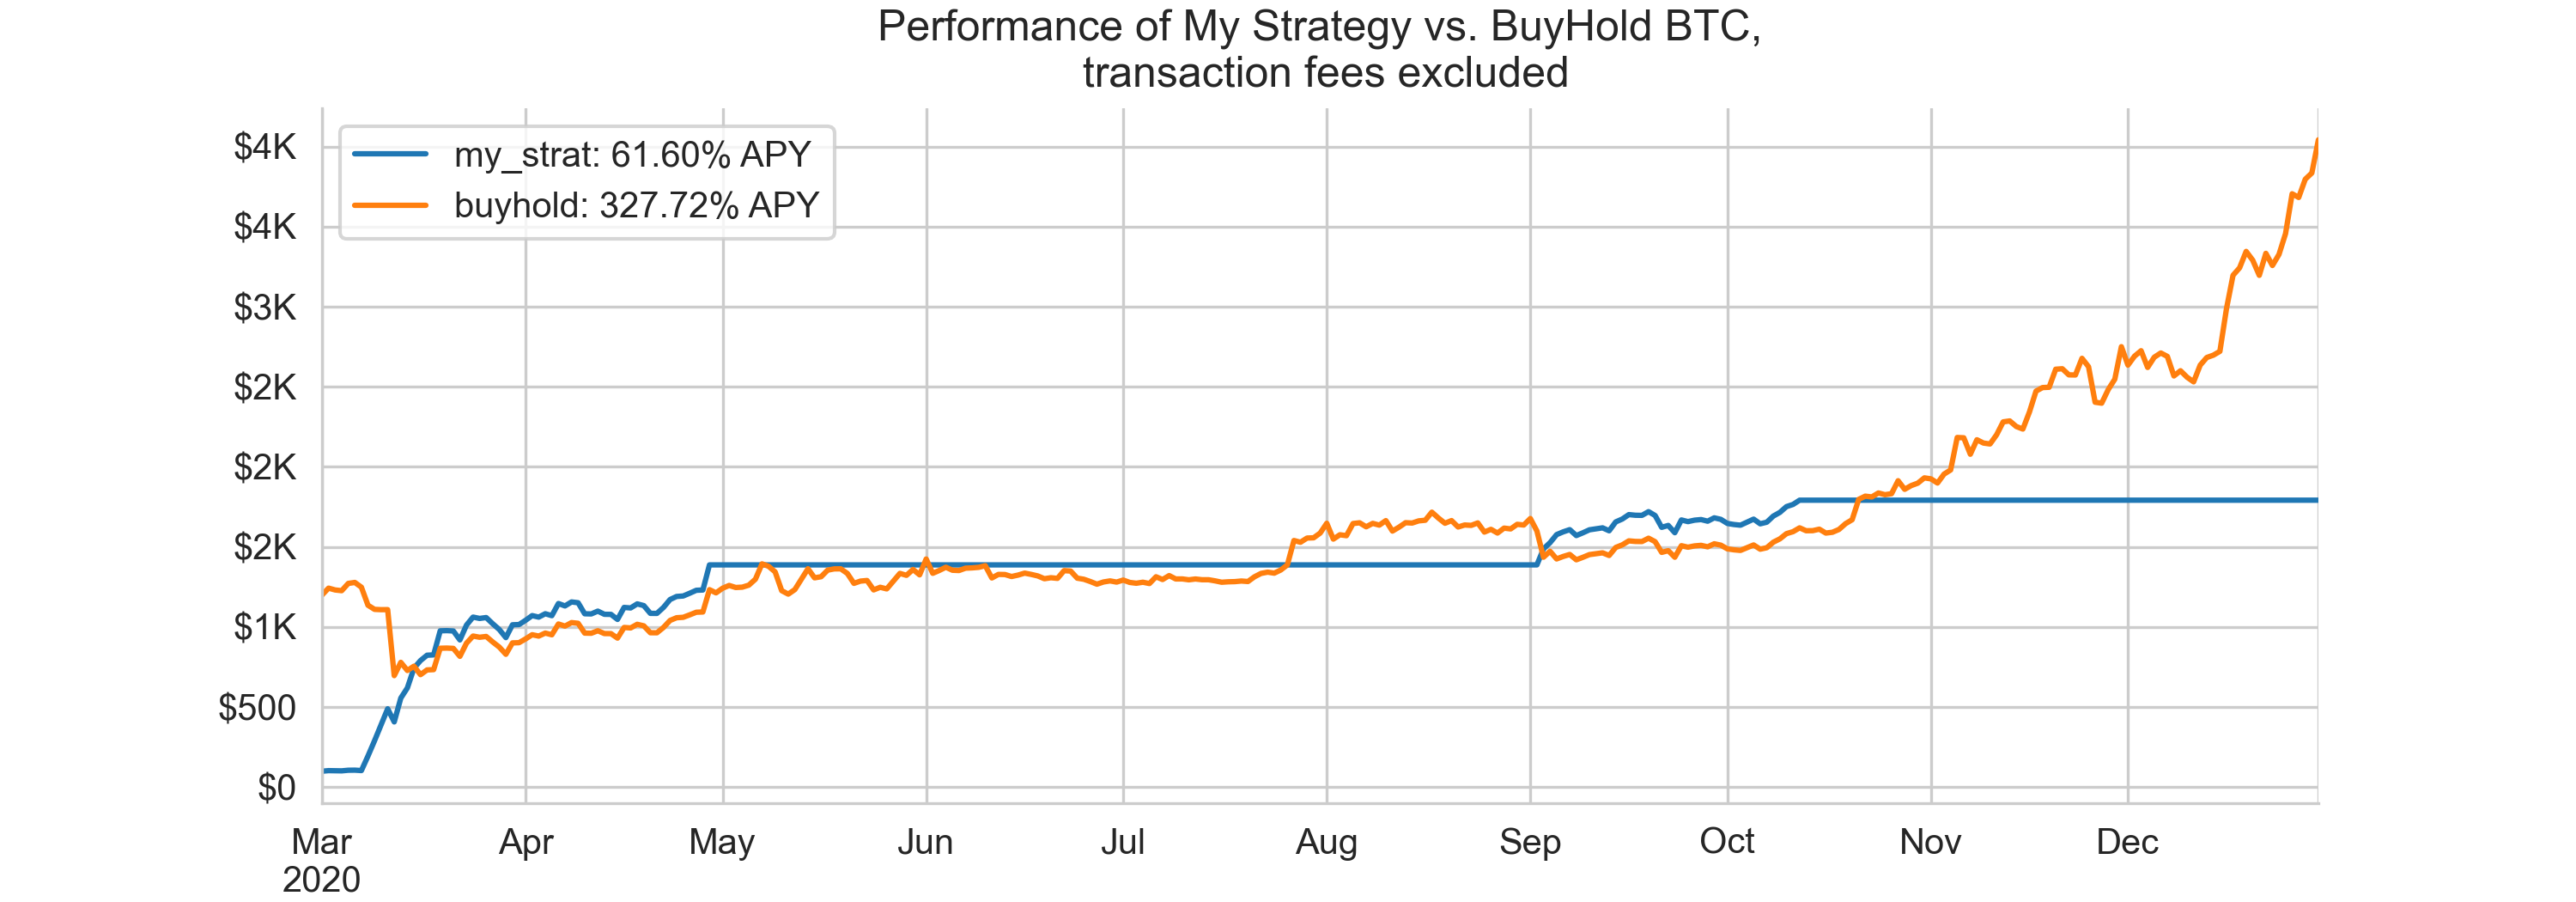
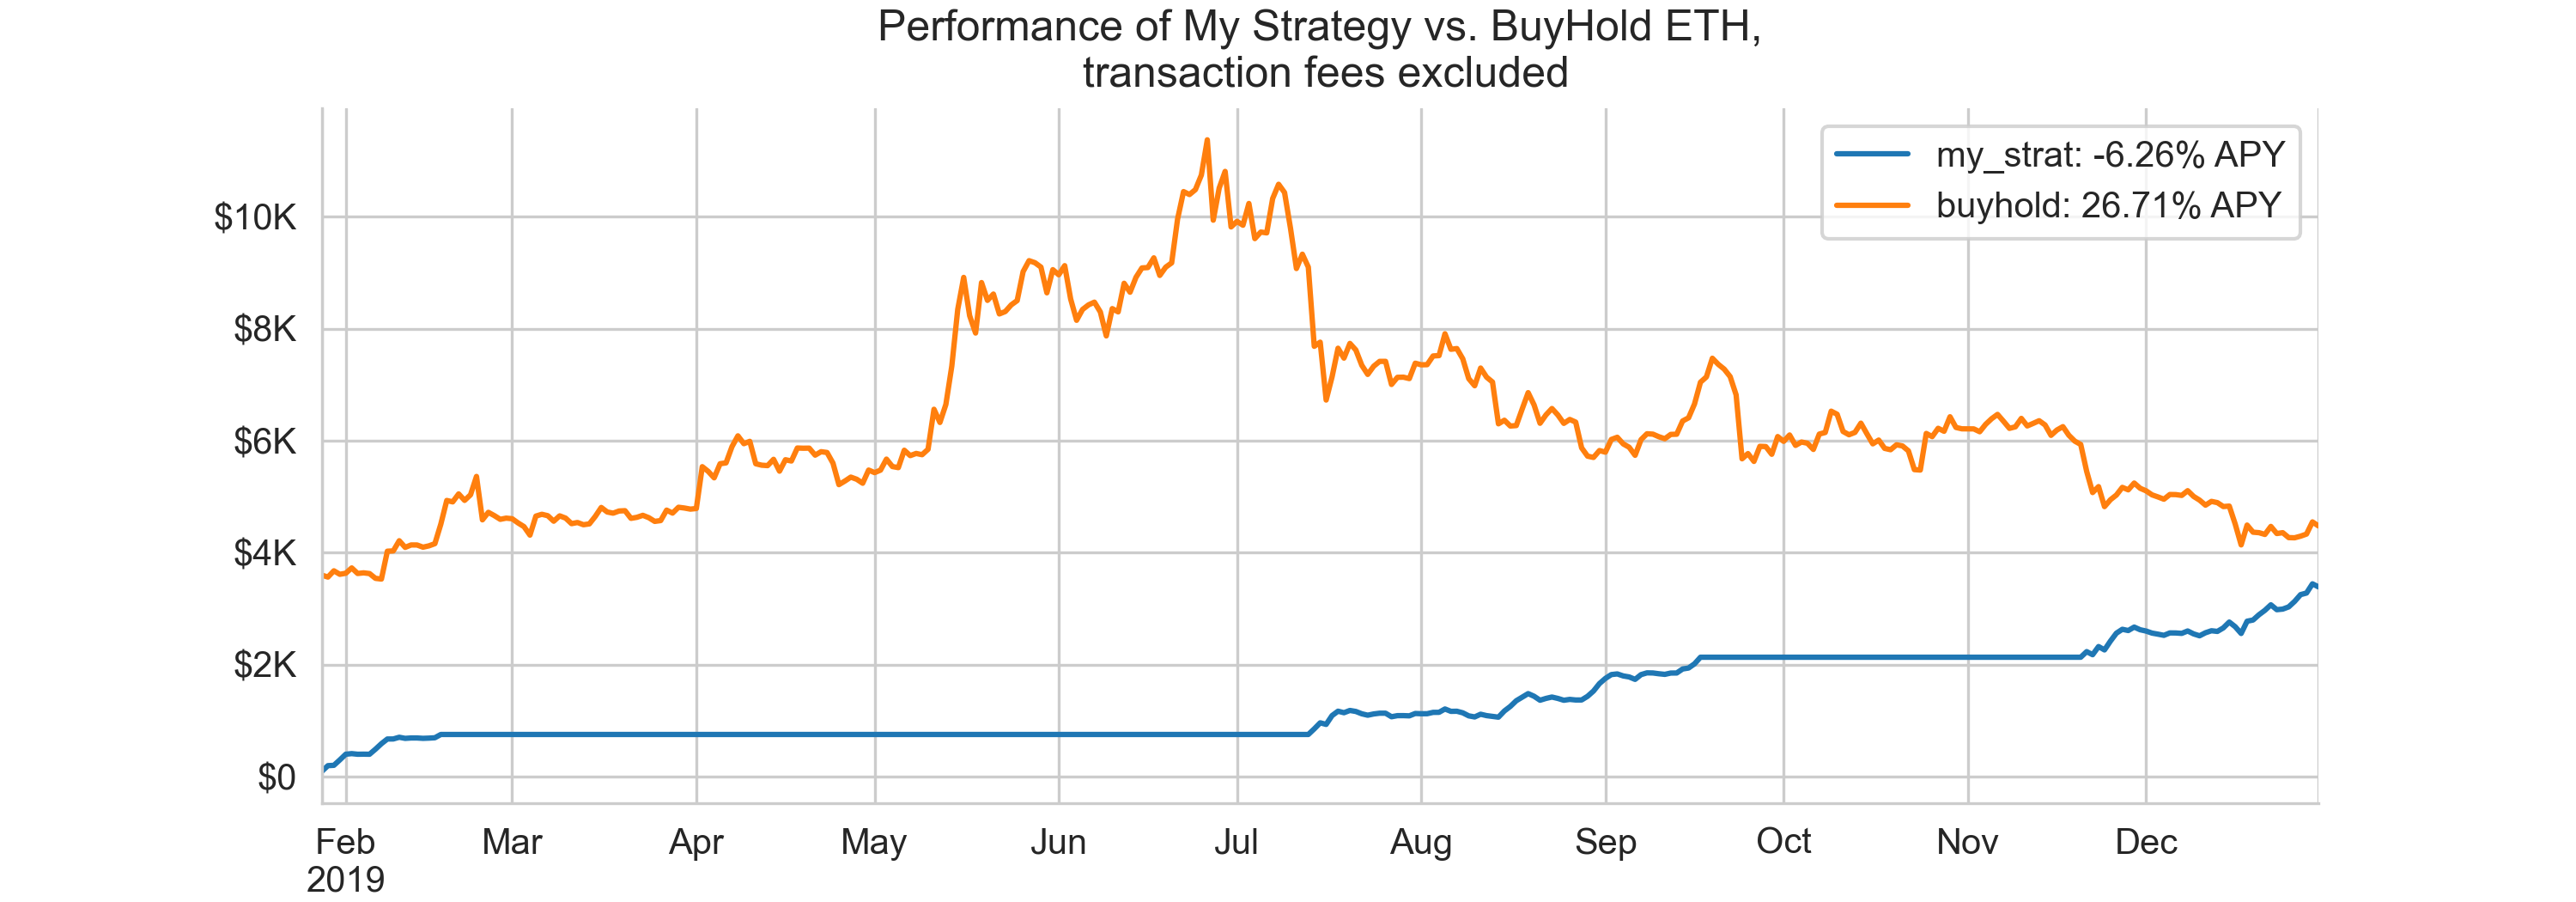
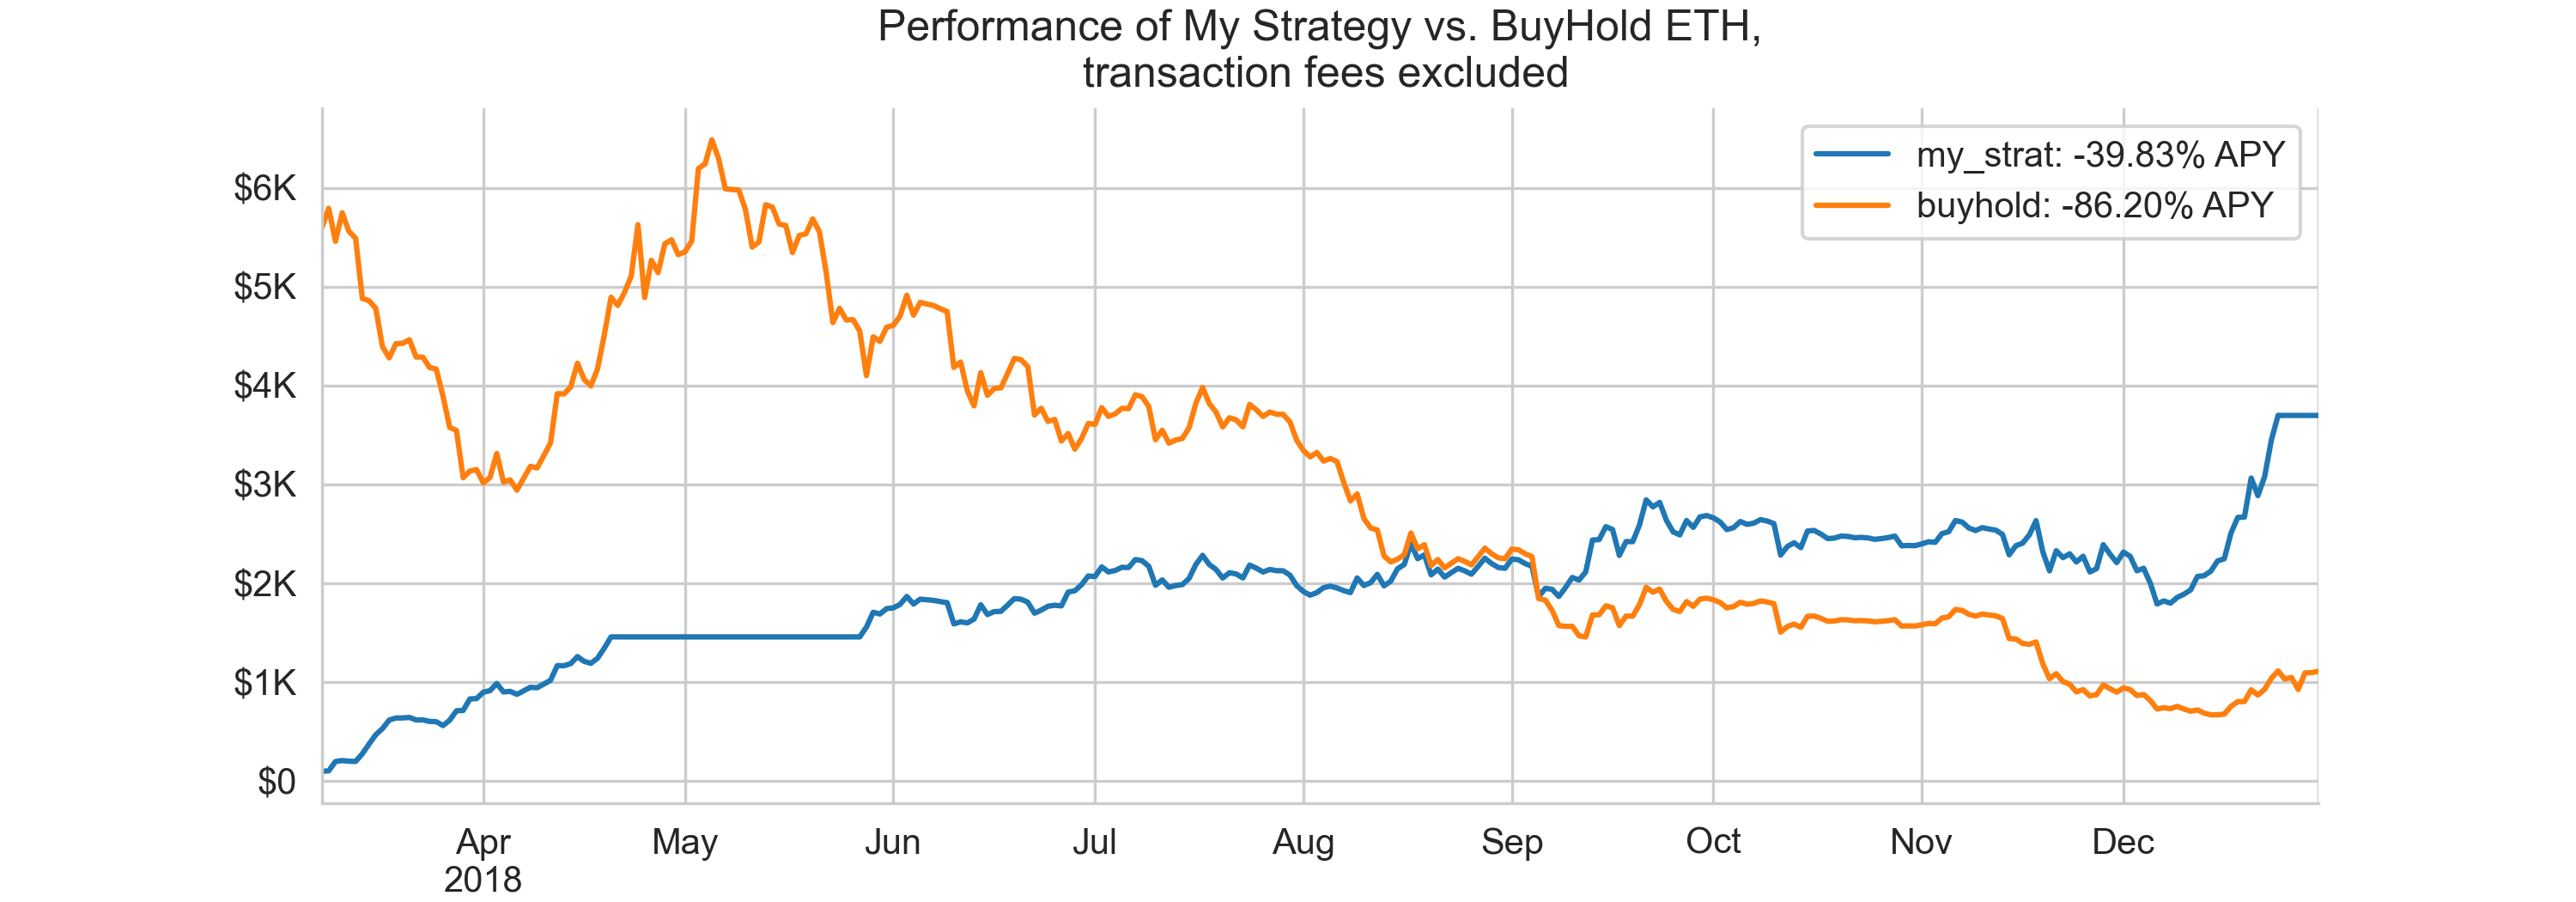
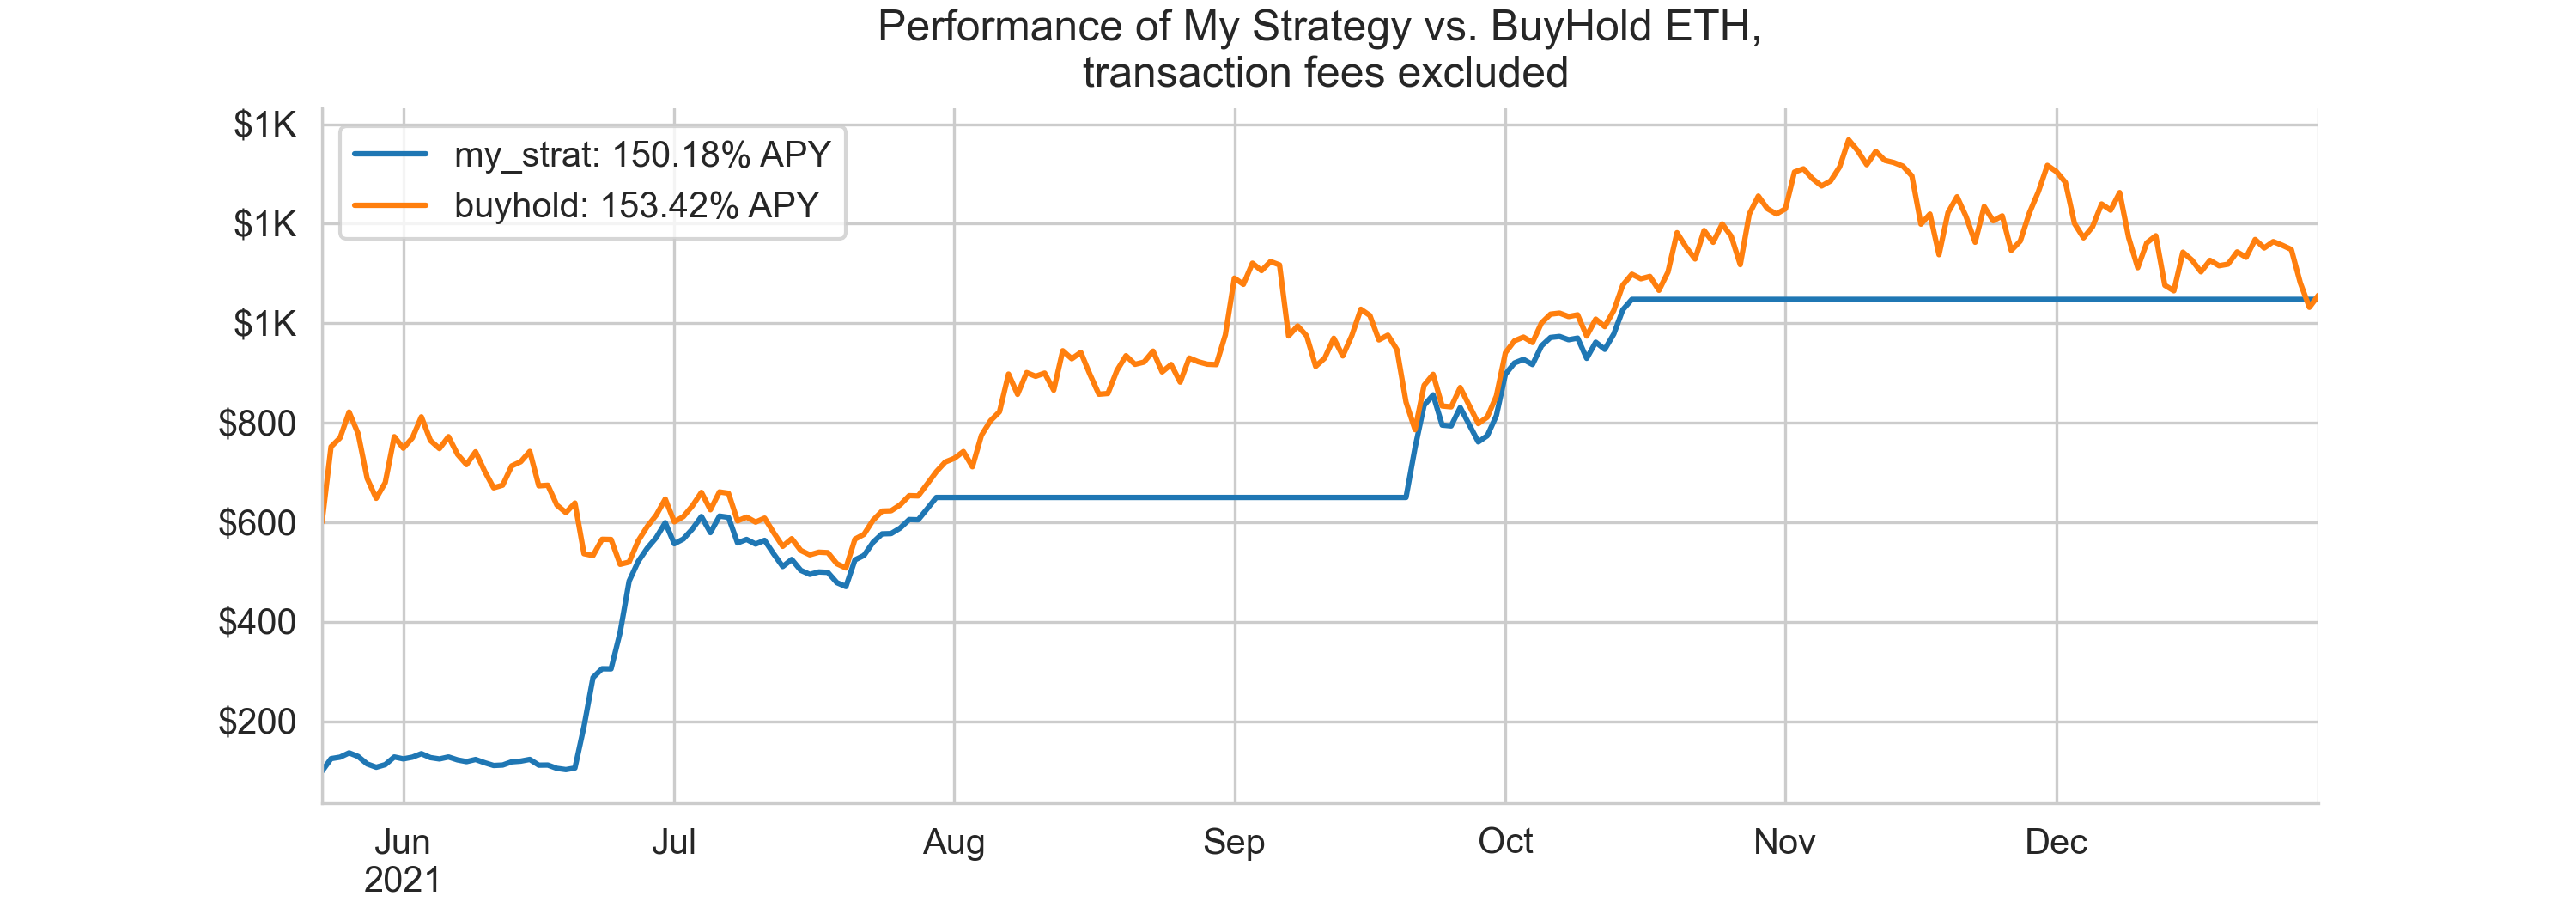
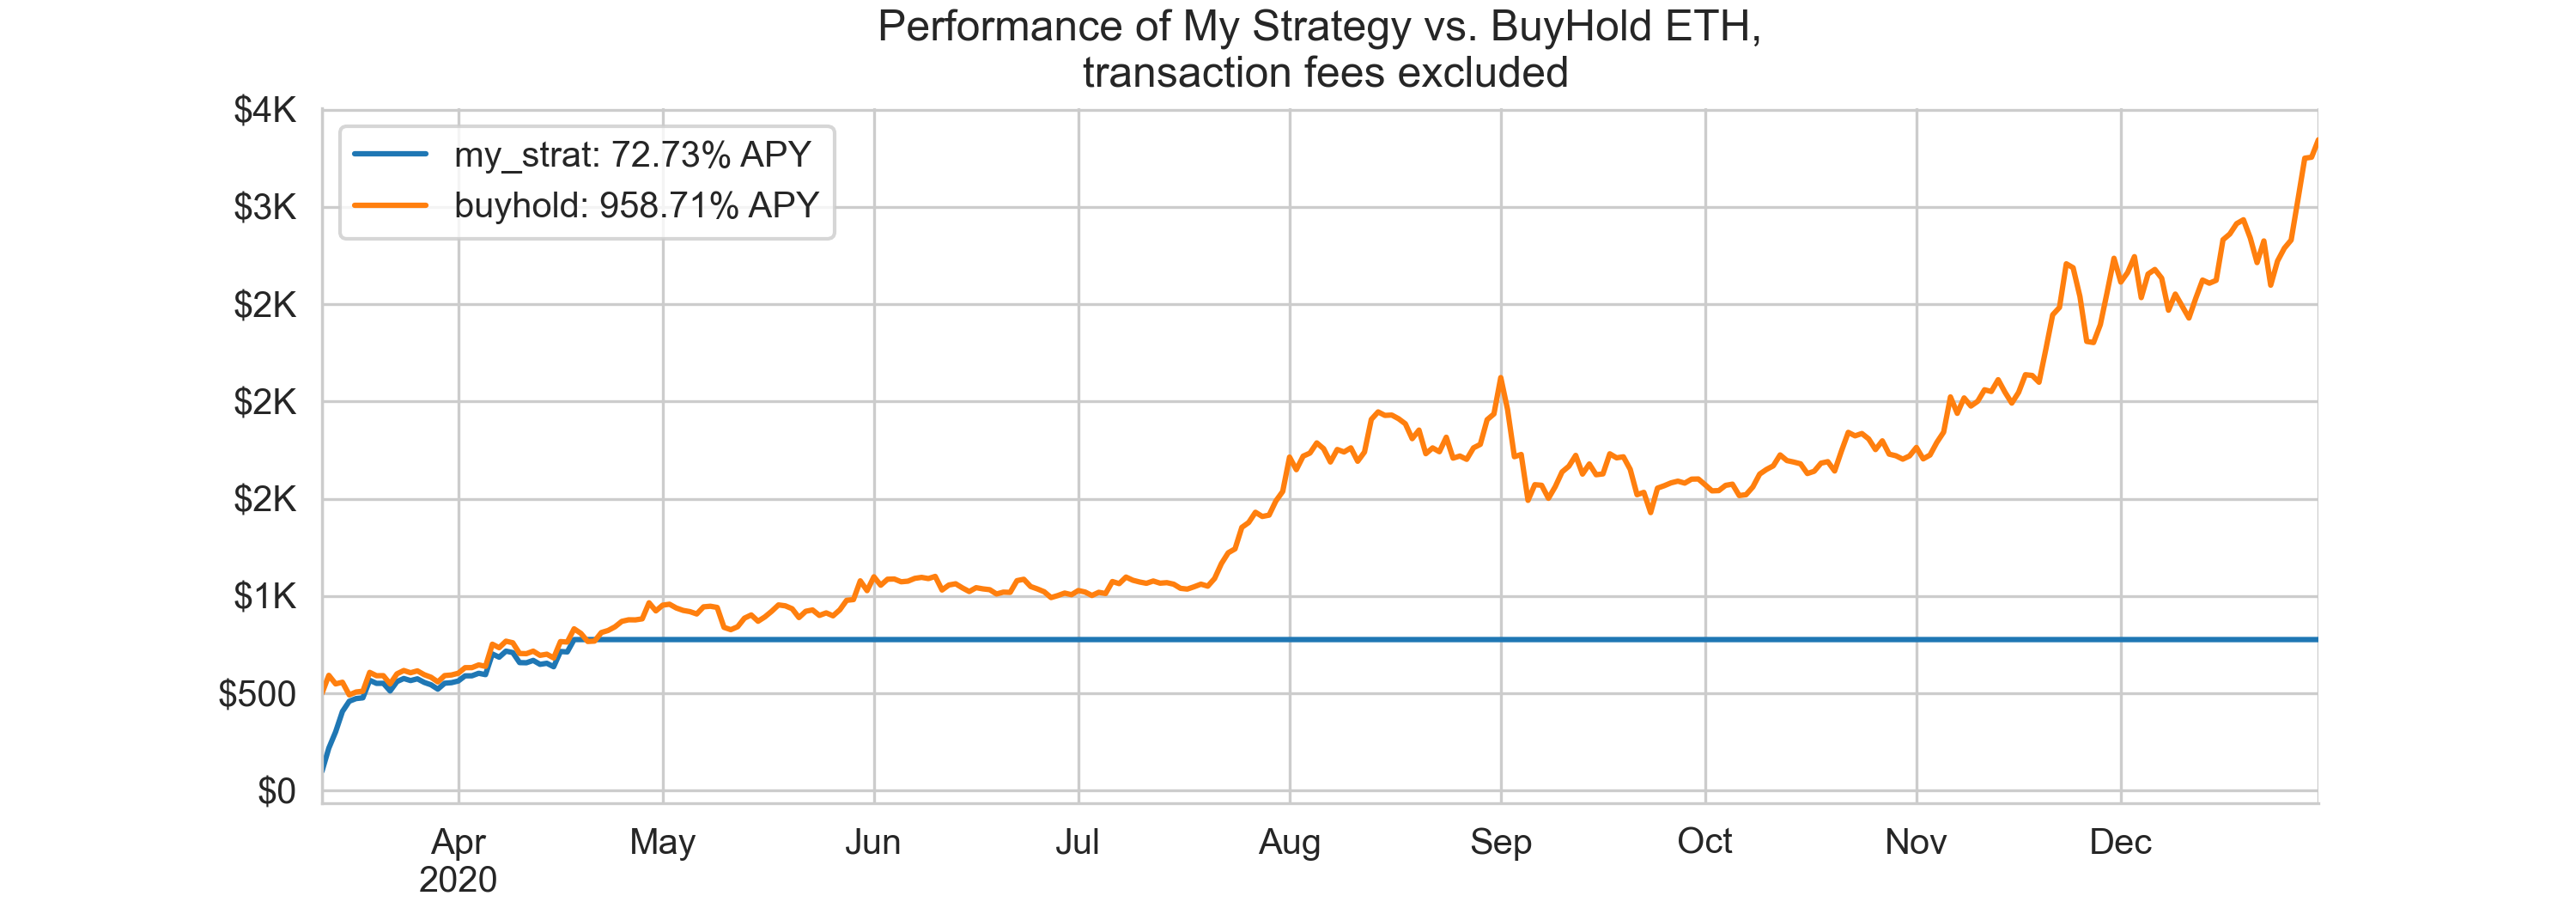
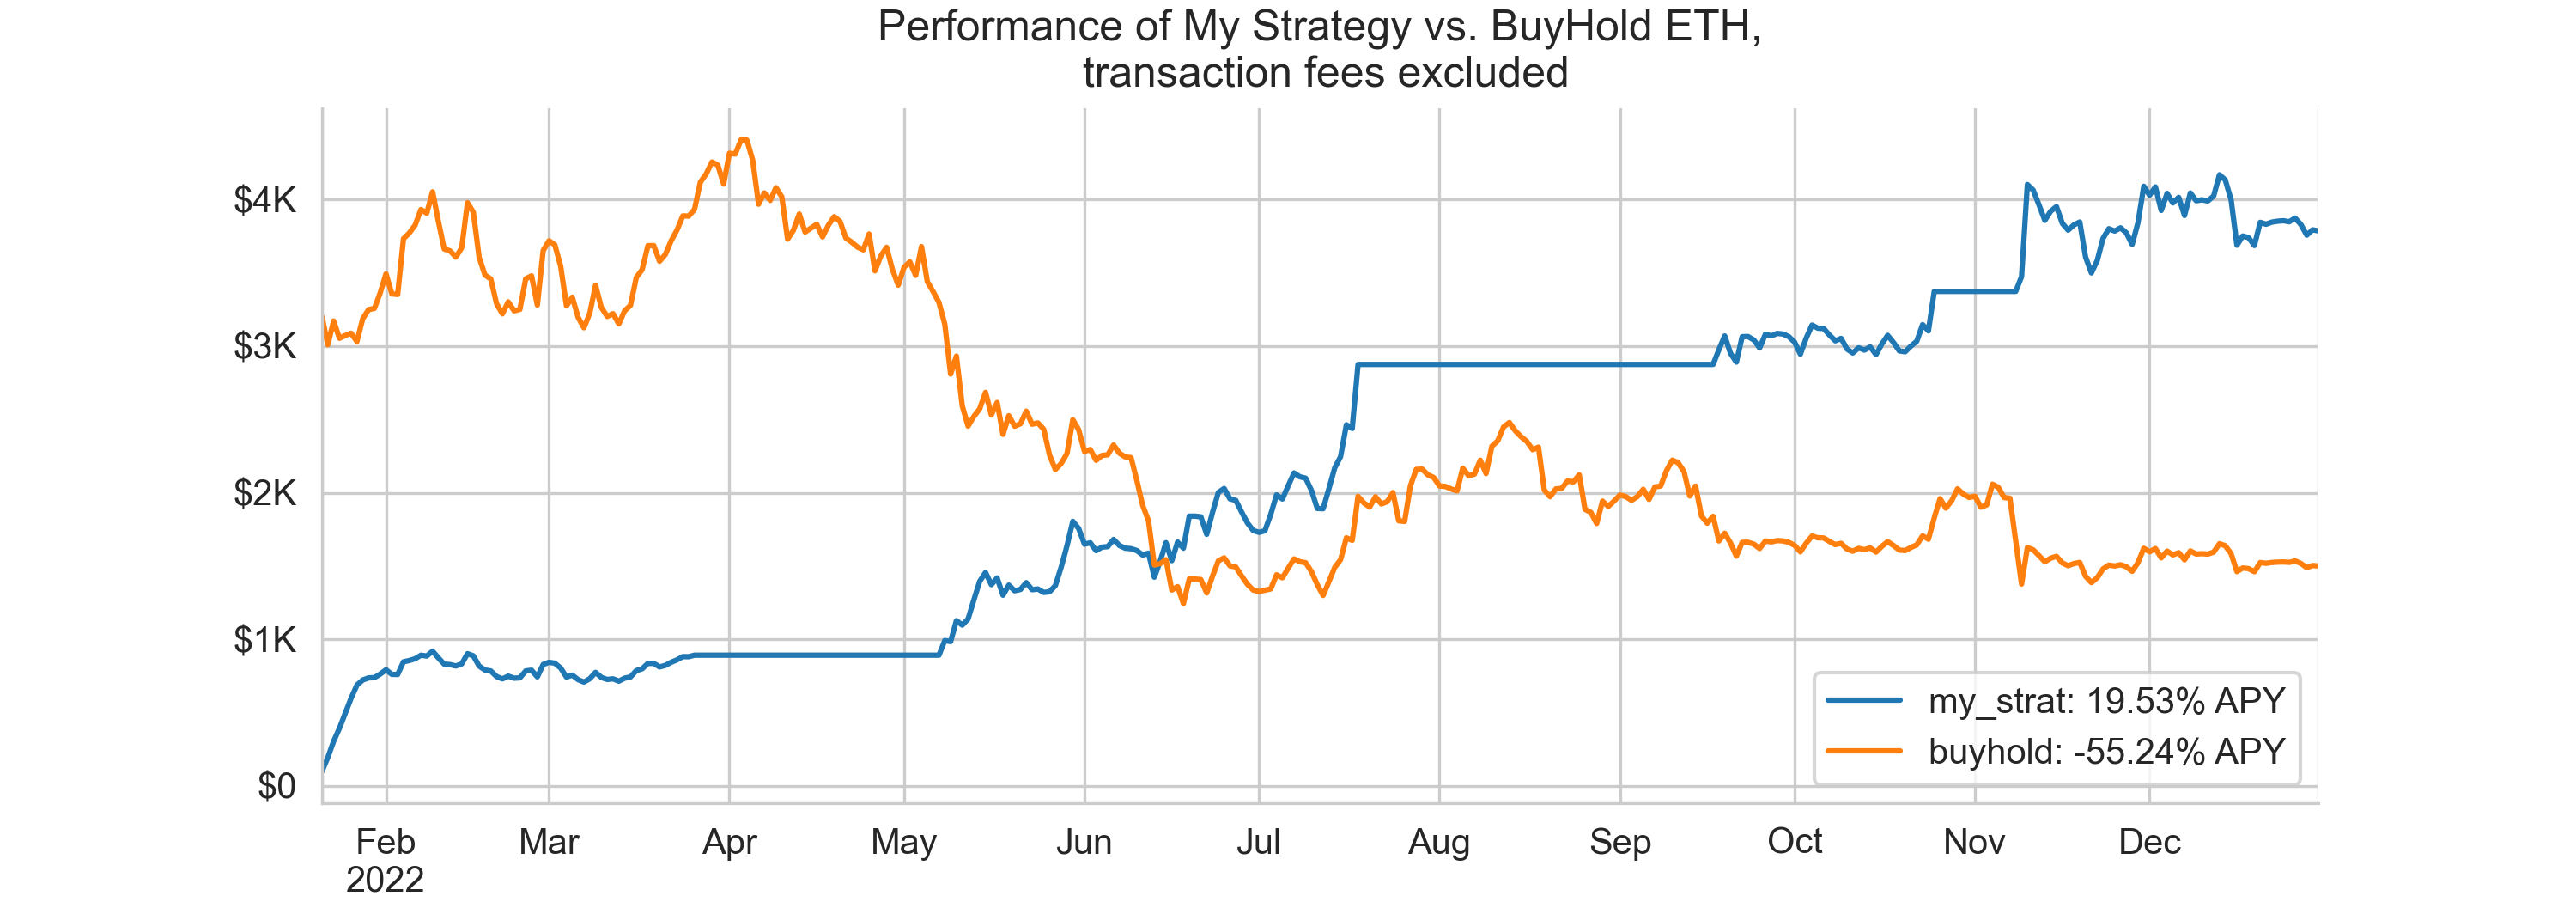
The following charts show backtest results for each year from 2018 to 2022. The take-away is that the strategy outperformed buyhold in a bear market but underperformed it in a bull market.
BTC
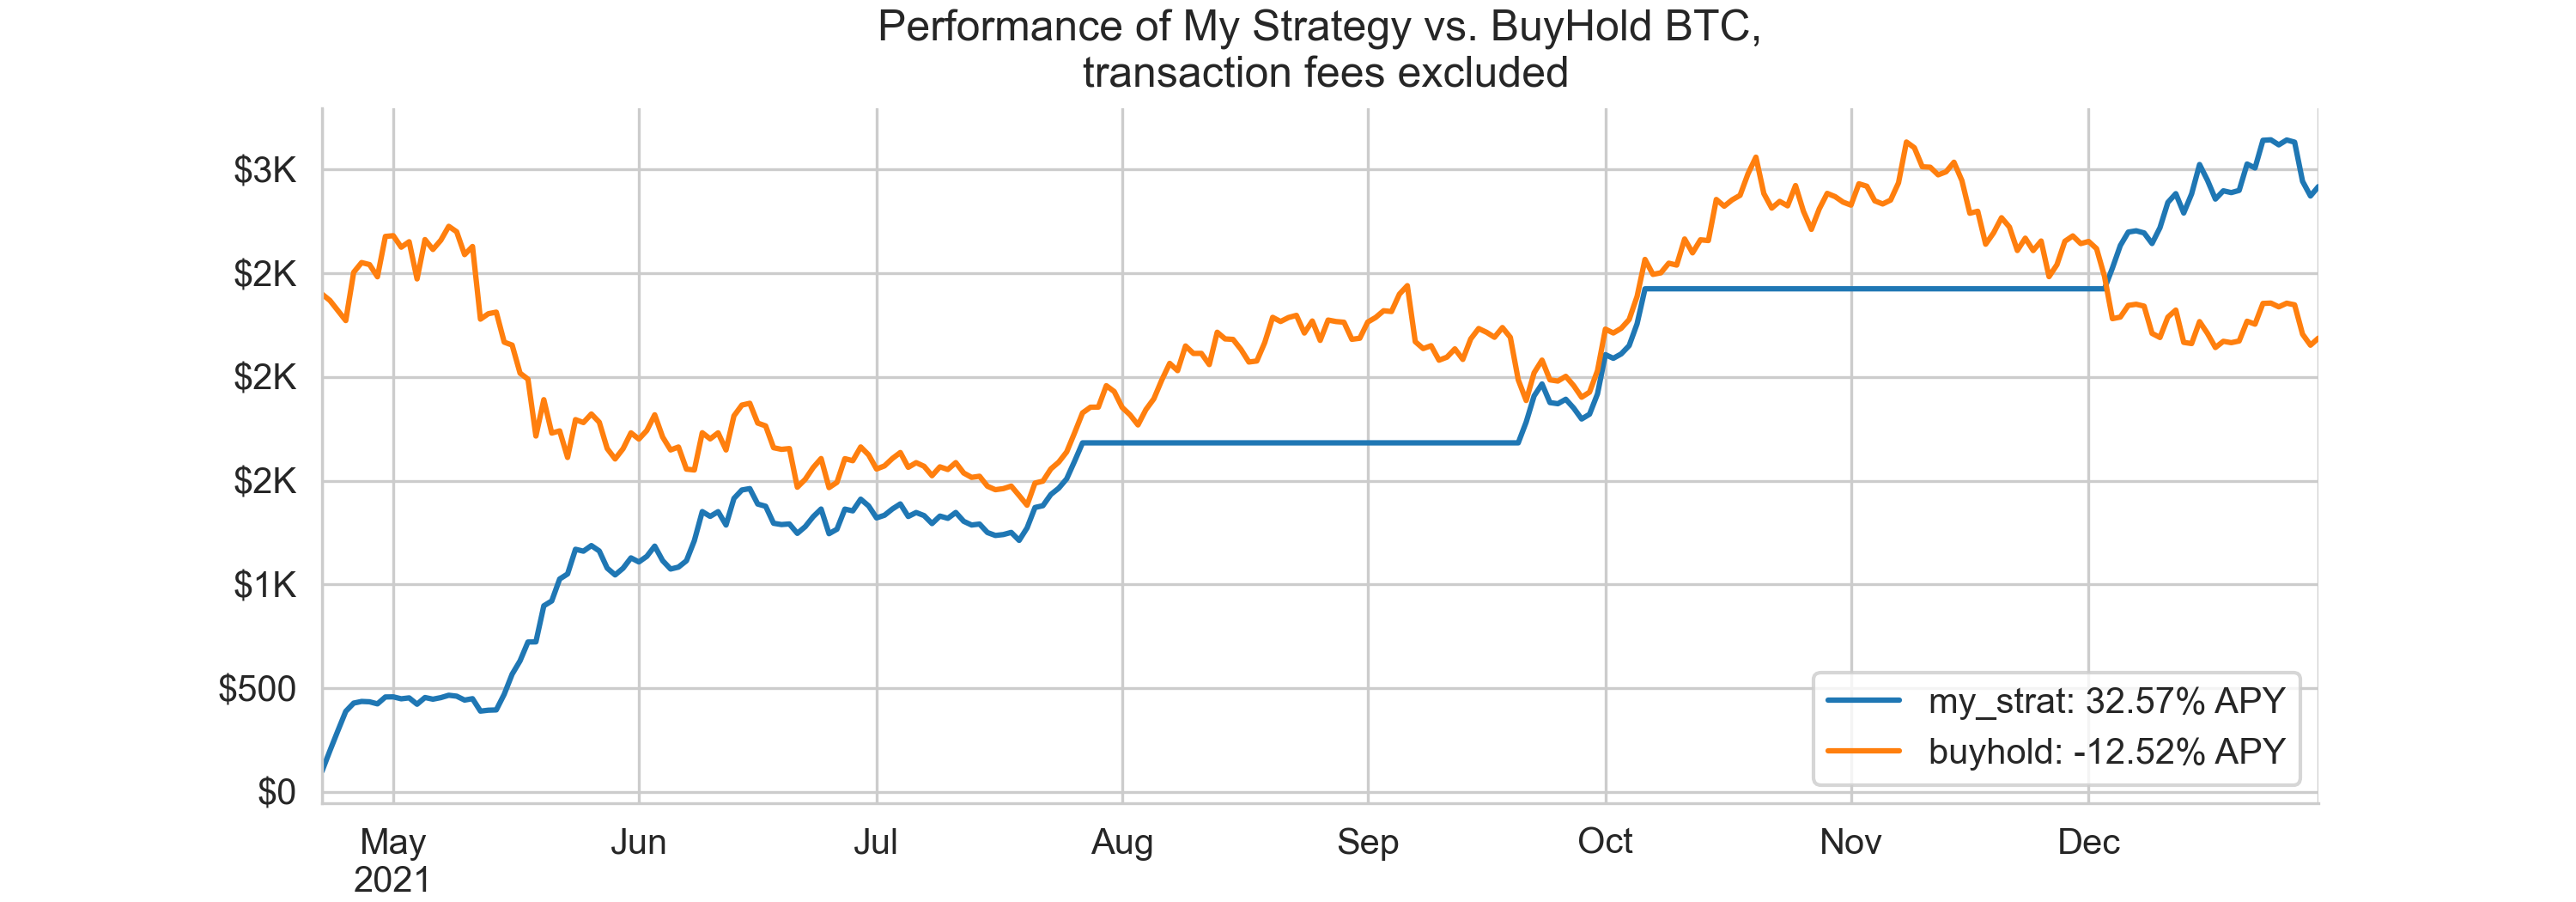
ETH
Improvement
One area of improvement is to create a training dataset and use it to pick the values of parameters in the strategy. What are they?
The rolling period for BBs and RSI calculation. I used 21 days and 14 days respectively because of consensus, but other values may work better for specific tokens/stocks.
The cutoff values for BBs and RSI. I chose 110% of BB bottom band and 90% of BB top band, and 35 and 65 as RSI thresholds on a whim. They maybe better selected using historical data.
Another area of improvement is to add more signals from other indicators, for example, MACD. There are 22 common indicators stock traders and researchers invented that may also be useful when trading cryptos. Finally, you can allow shorting and leverage and see how that changes the performance.
Code & Data
Python notebook. I encourage you to play with different values in the User Input section. You can easily adopt the script to a higher frequency if you have tick-by-tick data. For example, you can get high quality off-chain exchange data from tardis if you can afford it. Tardis is NOT a sponsor to this newsletter and I have no affiliation with them, although I used their data before. You can also get pretty granular data from defillama. For example, using the defillama2 python package, you can get hourly price data with one line of code:
obj.get_tokens_hist_prices(dd, '2022-11-01', '2022-11-30', 'hour')
Guides
Buy my UniV3 guide on Arbitrum and Polygon and access to the real time report card of my v3 positions.
Referrals
This section contains affiliate links to crypto products. If you click on the link and use the product, I may receive a small commission at no cost to you. I only link to products I use myself.
Get 5% discount when trading on GMX.
If you enjoyed this article and would like to buy me a coffee, you can send ETH, WBTC, AVAX, BNB, USDC, USDT to 0x783c5546C863f65481BD05Fd0e3FD5f26724604E, or you can tip me sat. Thank you and have a great day!